Howdy! 👋 #
A fine thing happened recently: Obisidian v1.0.0 was released. Which I discovered through this hacker news post. The comment section on Hacker News are usually 💰 and this one was no exception, here is a quote from the top comment:
Finally, a note taking application with a decent API that's allowed me to extract metadata and publish metrics into CloudWatch, allowing me to track key metrics and graphically[0] review historical trends of my "second brain." Previous note taking applications I've tried in the past (e.g. Zettlr, Bear) lacked the vibrant developer community that Obsidian has cultivated.
👆 Posts like this keep me coming back to Hacker News. Also, game recognises game. Here’s a link their blog post explaining the full stack and pipeline.
I bet you are sat there saying what if we could do something similar, but using only self hosted tools?
Well you, friend, are in luck.
Beginning the yak shaving #
Here is the flow I came up with for this experiment.
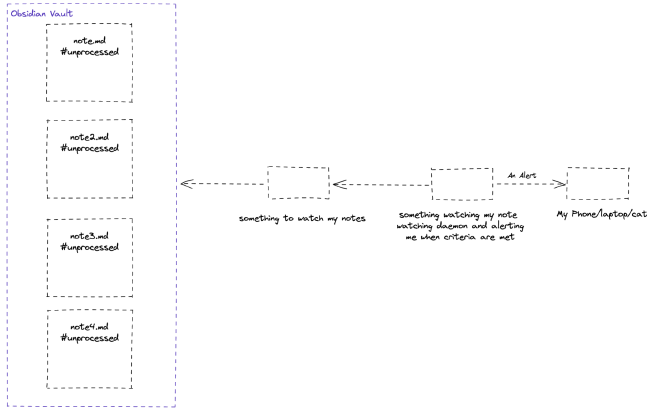
My daily template in Obsidian autopopulates the #unprocessed tag. In theory these are
processed daily, however, in practise that frequently doesn’t happen.
This is the stack:
| Tech | Use |
|---|---|
| Golang | Used to create the prometheus exporter |
| Prometheus | Used to track note metrics |
| Alert Manager | For handling alerts |
| Telegram | To receive notifications |
| Grafana | For visualising note metrics |
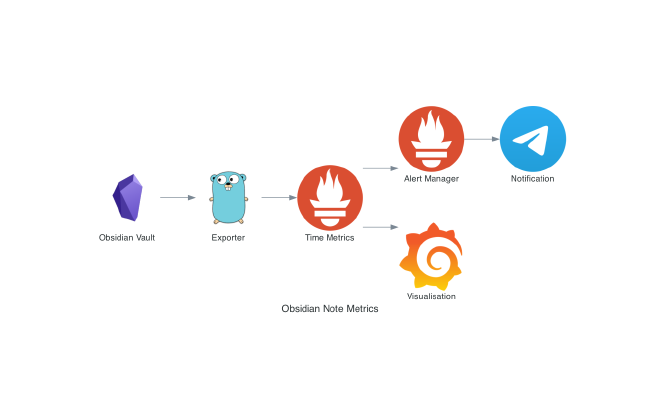
First things first, we need a program which can expose the unprocessed notes as a prometheus compatible metric. Follow the link to get instructions on how to set that up.
Consuming the data #
I already have Prometheus, Alert Manager and Grafana running in my network, however, the example directory contains a docker-compose example in case you want to get up and running quickly.
You’ll need to make a few changes to the alertmanager config and possibly check the prometheus scrape config too.
Next Steps #
- The exporter could be extended to show more metrics from your vault.
- I’d also consider removoing the additional prom stack and use something like this library instead.
- Grafana Dashboard for the truly insane who wish to graph their note history.